
The MySuper Product Dashboard provides members with important information about our MySuper product, the Active Super Saver Lifestage Product.
mysuper product dashboard
The information presented in MySuper product dashboards is standardised across funds to make it easy for members to compare different MySuper products. The MySuper product dashboard is based on a representative member with an account balance of $50,000 balance fully invested in that lifestage of the Active Super Saver Lifestage Product.
Use this Dashboard to compare the Active Super Saver Lifestage Product with other MySuper products.
You can go to ASIC’s MoneySmart website for more information on how to choose the right MySuper fund for you.
Last updated 1 March 2025
Vision Super and Active Super merged on 1 March 2025. The information included in this dashboard includes return history for the former Active Super fund (the predecessor fund, LGSS Pty Limited (ABN 68 078 003 497) (AFSL 383558), as Trustee for Local Government Super (ABN 28 901 371 321)(‘Active Super’)) as required by law, based on information provided by that fund. The returns of the Active Super Saver Lifestage product (as part of Vision Super) will depend on Vision Super’s investment outcomes (including fees and costs).
Accelerator - age up to 49
Comparison between return target and return
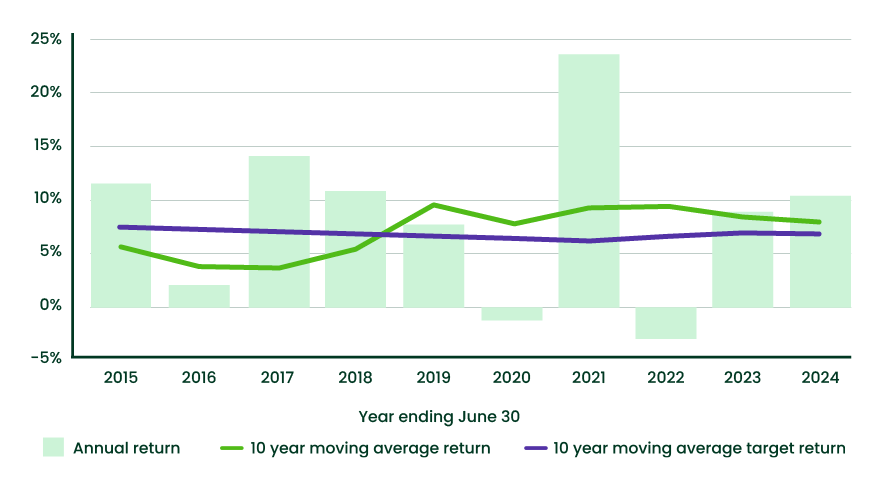
Return
8.2%
| Return target3.5%+CPI |
Statement of fees and other costs$466 | Level of investment risk
High
|
Accumulator – age 50-54
Comparison between return target and return
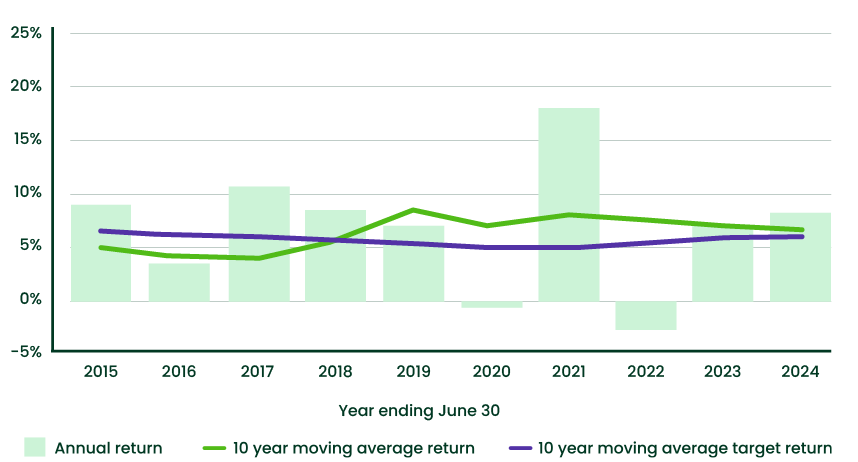
Return
6.82%
| Return target3.0%+CPI |
Statement of fees and other costs$436 | Level of investment risk
Medium to High
|
Appreciator – Age 55+
Comparison between return target and return
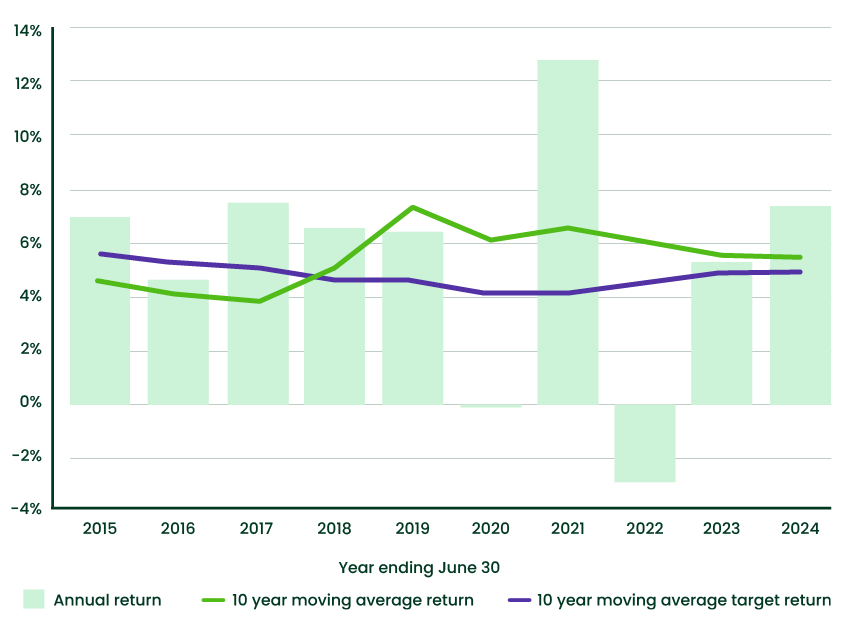
Return
5.35%
| Return target2.0%+CPI |
Statement of fees and other costs$421 | Level of investment risk
Medium to High
|
Glossary
Return
The return is an average net return over the 10 years to 30 June 2024. The return is net of all investment, administration fees, advice fees, costs and taxes for a representative member. It is important to remember that past performance is no indicator or guarantee of future performance, and the value of investments can rise or fall.
Return target
The return target is expressed as a target level of return above inflation (as measured by the Consumer Price Index) over a ten-year period. The return target is the average of the expected annual returns for the ten-year period, based on long-run return assumptions, net of all investment, administration and advice fees, costs and taxes. The return target does not constitute a forecast or guarantee of future performance or future rate of return.
Level of investment risk
The level of investment risk is based on the Standard Risk Measure (SRM). For more information, please read the Risks in super in super additional guide.
Statement of fees and other costs
The statement of fees and other costs shows the dollar value of investment, administration and advice fees and costs for a representative member. For further information on the underlying fees, please read the Fees and costs additional guide.
Comparison between return target and return
The columns in the graph show the one-year net return for each year to 30 June. The green line shows the 10-year moving average net return to 30 June of each year. The purple line shows the 10-year moving average target return to 30 June of each year.
